Improve website conversion rate: your 2026 guide
21 June 2026 · 3 min read
Improve website conversion rate: your 2026 guide

Conversion rate optimisation (CRO) is defined as the process of increasing the percentage of website visitors who complete a desired action, such as making a purchase, submitting an enquiry, or signing up for a service. This improve website conversion rate guide covers the tools, tactics, and testing methods that produce measurable results. The stakes are significant: moving from 2% to 3% conversion rate means 50% more revenue from identical traffic. With AI-driven changes reducing click-through rates in 2026, extracting more value from existing visitors is no longer optional. Page speed, user experience, trust signals, and systematic A/B testing are the four pillars that determine whether your site converts or loses business daily.
What are the essential tools for conversion rate optimisation?
Accurate measurement comes before any improvement. Without it, you are guessing. Google Analytics provides baseline conversion data and segment tracking. Heatmap tools show where visitors click, scroll, and ignore. Session replay software records individual user journeys and exposes frustration points that aggregate data never reveals. These three tool types form the diagnostic foundation of any serious CRO programme.
Establishing your baseline conversion rate by page and traffic source is the starting point. A landing page converting at 1.2% from paid search tells a different story than the same page converting at 4.8% from organic. Segment your data before drawing conclusions.

Pro Tip: Start by watching recordings of sessions that ended without a conversion. Patterns emerge within 20 sessions. You will spot broken buttons, confusing layouts, and dead-end pages faster than any spreadsheet can show you.
| Tool | Purpose | Strength | Limitation |
|---|---|---|---|
| Google Analytics | Traffic and conversion tracking | Free, deep segmentation | No visual behaviour data |
| Heatmap tools | Attention and click mapping | Visual, intuitive | Snapshot only, no replay |
| Session replay software | Individual user journey recording | Reveals real friction points | Time-intensive to review |
| A/B testing platforms | Variant comparison | Data-driven decisions | Needs sufficient traffic |
Prioritise high-traffic, high-value pages for your initial analysis. Compounding gains come from improving pages that already receive volume, not from fixing pages nobody visits.
How does page speed affect your conversion rate?
Speed is not a technical nicety. It is a direct revenue lever. A one-second delay cuts conversions by 7%. Sites that take three seconds to load lose 32% of users before a single word is read. At six seconds, the probability of a visitor bouncing rises to 106% above baseline. These numbers make page speed the highest-return technical fix available to most businesses.
The practical actions are well established:
- Convert images to WebP format to reduce file size without visible quality loss
- Enable browser caching so returning visitors load pages faster
- Minify CSS, JavaScript, and HTML files to remove unnecessary code
- Use a content delivery network (CDN) to serve assets from servers closer to the visitor
- Remove third-party scripts that are not actively contributing to conversions
Mobile performance deserves separate attention. Mobile conversion rates are 40–60% lower than desktop, largely because most businesses test on simulators rather than real devices. Simulators miss small tap targets, font rendering issues, and layout shifts that real users encounter daily. Test on actual Android and iOS handsets before declaring a page ready.
Pro Tip: Use Google PageSpeed Insights and GTmetrix together. PageSpeed Insights gives you Core Web Vitals scores that affect search ranking. GTmetrix gives you a waterfall chart showing exactly which assets are slowing the page down.
How to improve the user journey and boost conversions
Navigation clarity determines whether a visitor finds what they came for or leaves. On key landing pages, remove header menus, sidebars, and footer links that pull attention away from the primary action. A page with one goal converts better than a page with twelve options.
Calls to action (CTAs) are where most businesses leave money on the table. Generic phrases like “Submit” or “Click here” perform poorly. Action-oriented language such as “Start my free trial” or “Get my instant quote” converts better because it tells the visitor exactly what happens next. Specificity builds commitment.
Forms are a major source of abandonment. Reducing a checkout form from 8 to 4 fields can increase completion rates by 15%. Every field you ask for is a reason to leave. Ask only for what you genuinely need at that stage of the relationship.
Trust signals close the gap between interest and action. 85% of consumers read reviews before buying, and social proof lifts conversions by 18–25%. Place testimonials, star ratings, and case study references near your CTAs, not buried in a separate page. Proximity to the decision point is what makes them work. You can read more about how website design affects trust and why it matters for service businesses specifically.
| UX improvement | Conversion impact | Priority |
|---|---|---|
| Removing navigation from landing pages | Reduces distraction, increases focus | High |
| Specific CTA language | Increases click-through and commitment | High |
| Reducing form fields | Reduces abandonment, increases completion | High |
| Adding testimonials near CTAs | Builds trust at decision point | Medium |
| Personalising page content by source | Increases relevance and engagement | Medium |
For service businesses, the conversion-focused web design principles that work in e-commerce translate directly to enquiry forms, quote requests, and callback bookings.
How do you run a systematic A/B testing process?
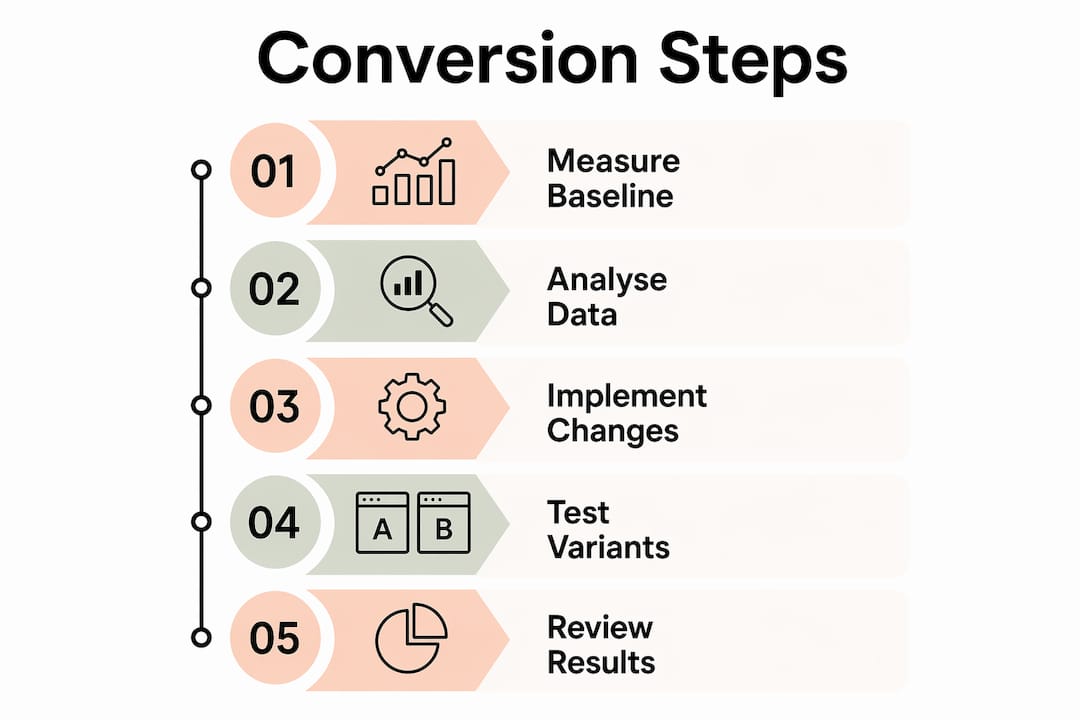
Data-driven testing is the mechanism that separates sustained CRO gains from one-off improvements. A/B testing and continuous optimisation deliver returns of 200% to 1,000% within 90 days when applied to high-traffic pages. The process follows five steps:
- Measure your current conversion rate for the specific page and action you want to improve.
- Analyse session replays and heatmaps to identify where users drop off or show frustration.
- Hypothesise a specific change based on evidence, not preference. “Changing the CTA from ‘Submit’ to ‘Get my quote’ will increase clicks because it is more specific.”
- Test by running both variants simultaneously with equal traffic until you reach statistical significance.
- Implement the winning variant and begin the cycle again on the next priority.
Intuition is wrong roughly half the time when selecting which tests to run. The ICE framework (Impact, Confidence, Ease) removes personal bias from test prioritisation. Score each potential test on all three dimensions and run the highest-scoring tests first. This focuses your effort on experiments most likely to produce meaningful results.
Pro Tip: Never end a test early because one variant looks like it is winning. Statistical significance requires enough data to rule out chance. Most A/B testing platforms show a confidence percentage. Wait for 95% before acting.
A common mistake is testing too many variables at once. Change one element per test. If you alter the headline, CTA, and image simultaneously, you cannot know which change drove the result.
What mistakes undermine conversion rate improvements?
Several recurring errors prevent businesses from seeing results despite genuine effort.
- Ignoring mobile entirely. A desktop-optimised page with a broken mobile layout loses the majority of modern traffic before any other factor comes into play.
- Acting on intuition without data. Changing a page because it “looks better” without a hypothesis or test produces unpredictable results.
- Poor data quality. Tracking errors, duplicate goals, and unfiltered internal traffic produce misleading baselines. Audit your analytics setup before drawing conclusions.
- Slow implementation cycles. Running a test, confirming a winner, and then waiting three months to implement it wastes the compounding effect that CRO depends on.
- Unclear value propositions. Visitors who cannot immediately understand what you offer and why it matters to them will leave. Your headline must answer “What is this and why should I care?” within three seconds.
Design clutter compounds every other problem. Busy pages with competing visual elements, pop-ups, and auto-playing video create cognitive overload. Visitors do not work harder to understand a confusing page. They leave. Simplicity is not a design preference. It is a conversion strategy. If you are unsure where to start, a structured website conversion checklist gives you a clear audit framework.
Key takeaways
Sustained conversion rate improvement requires accurate measurement, targeted changes, and continuous testing rather than one-off redesigns.
| Point | Details |
|---|---|
| Measure before you change | Set up Google Analytics, heatmaps, and session replay before making any alterations. |
| Speed is a revenue issue | A one-second delay cuts conversions by 7%; fix load times before anything else. |
| Simplify forms and CTAs | Reducing form fields and using specific CTA language produces fast, measurable gains. |
| Use social proof near CTAs | Testimonials and reviews placed at the decision point lift conversions by 18–25%. |
| Test one variable at a time | Run statistically valid A/B tests using the ICE framework to remove guesswork. |
What I have learned from real CRO work
The biggest misconception I see is that CRO is a project with a finish line. Businesses invest in a redesign, see an initial lift, and then stop. Six months later, the gains have eroded because competitors have improved, visitor expectations have shifted, and the site has not kept pace.
The businesses that compound their conversion gains treat optimisation as a habit. They review session replays weekly. They run at least one active A/B test at all times. They check their Core Web Vitals scores monthly. None of this requires a large team or a large budget. It requires consistency.
The other pattern I see consistently is mobile neglect. A business will spend weeks perfecting a desktop experience and then assume the mobile version is “fine.” It rarely is. Tap targets are too small, forms are awkward on a touchscreen, and CTAs are buried below the fold. Testing on a real device for 20 minutes will surface more actionable problems than a month of desktop analysis.
Qualitative data is underused. Numbers tell you that 68% of visitors leave a page without converting. Session replays tell you why. Both are necessary. Neither is sufficient alone. The businesses that combine Google Analytics with tools like Inspectlet or Hotjar consistently outperform those relying on dashboards alone.
Treat CRO as a continuous optimisation habit, not a campaign. The compounding effect over 12 months is significant.
— Ben
How gtwelve helps you convert more visitors into enquiries
gtwelve builds conversion-focused websites for UK service businesses and trades, combining design, technical performance, and enquiry workflows into one system. If your site is generating traffic but not enough leads, the problem is usually identifiable and fixable.

gtwelve carries out website audits that cover page speed, CTA effectiveness, form design, trust signals, and mobile performance. Every audit produces a prioritised action plan, not a generic report. From there, gtwelve can implement changes, connect enquiries into your calendar or quote workflow, and track the results. If you want more from your existing traffic, see how gtwelve works and get in touch for a straightforward conversation about what is holding your site back.
FAQ
What is a good website conversion rate?
A good conversion rate varies by industry and traffic source, but most service websites aim for 2–5% on key landing pages. Paid traffic typically converts lower than organic or referral traffic.
How quickly can I improve my conversion rate?
Speed and CTA changes can show results within days of implementation. A/B tests require enough traffic to reach statistical significance, which typically takes two to four weeks on moderate-traffic pages.
Do I need a developer to run A/B tests?
Many A/B testing platforms allow no-code tests on headlines, CTAs, and images. Developer support is needed for structural page changes or server-side tests.
Why are my mobile conversions so much lower?
Mobile conversion rates are 40–60% lower on most sites due to layout friction, small tap targets, and slow load times that simulators do not reveal. Test on real devices to find the specific issues.
What is the ICE framework in CRO?
ICE stands for Impact, Confidence, and Ease. It is a scoring method used to prioritise which A/B tests to run first, based on potential return and feasibility rather than personal preference.
Recommended
If this sounds like your website, we can take a look.
Note 33 of 72