Website analytics explained for business owners
3 July 2026 · 3 min read
Website analytics explained for business owners

Website analytics is the systematic collection, analysis, and reporting of data about how visitors find, interact with, and convert on your website. The industry standard term is “web analytics,” and understanding it is the foundation of every sound digital marketing decision. A 1-point lift in conversion rate directly reduces the cost to acquire each customer. That single fact makes website analytics one of the highest-return activities a business owner or marketing professional can invest time in. This guide covers what website analytics tracks, how it works technically, which metrics matter most, and how to apply the data to improve performance and customer engagement.
What is website analytics explained: the data it tracks
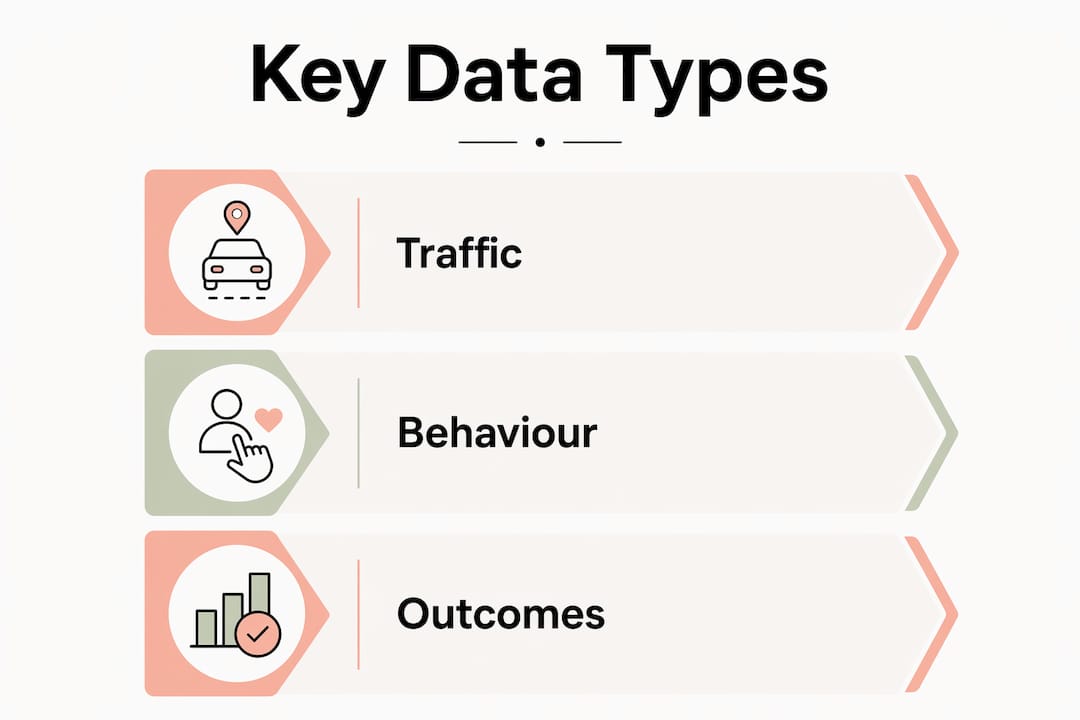
Web analytics captures three distinct categories of data, each answering a different business question.
Traffic data tells you how visitors arrive. Sources include organic search, paid advertising, social media, direct visits, and referral links from other websites. Knowing which channel drives the most visits is only the start. The real value comes from comparing which channel drives the most conversions, not just volume.

Behavioural data tells you what visitors do once they arrive. Key signals include pageviews, session duration, bounce rate, and user flow through the site. Traffic sources and visitor behaviour answer fundamentally different questions. Traffic data tells you where people come from; behavioural data tells you why they act the way they do. Both are needed to tailor the user experience effectively.
Outcome data tells you whether the site is doing its job. Conversions can be hard (a completed enquiry form or purchase) or soft, such as a video play, a document download, or a phone number click. These soft actions are called micro-conversions, and tracking them reveals where in the funnel visitors are dropping away before they reach the main goal.
The most reliable source for all three categories is first-party data collected directly from your own site. Third-party tools provide useful estimates for benchmarking against competitors, but they are not precise enough for internal decision-making.
Pro Tip: Set up separate views or segments for each traffic source from day one. Mixing organic and paid traffic into a single report hides the true performance of each channel.
How do website analytics tools collect data?
Every mainstream analytics platform collects data through a JavaScript tracking snippet placed on each page of your website. When a visitor loads a page, the snippet fires and sends data points, including page URL, referrer, device type, and browser, to the analytics server.
Google Analytics 4 is the industry standard for web analytics setup. A typical GA4 implementation follows these steps:
- Create a Google Analytics account and set up a new GA4 property.
- Add a web data stream for your website domain.
- Install the GA4 tracking code, either directly in the site’s HTML or via Google Tag Manager.
- Configure conversion events to track the specific actions that matter to your business.
- Verify data is flowing correctly using the GA4 real-time report.
Google Tag Manager simplifies step three considerably. It acts as a container that holds all your tracking scripts in one place, so you can add or update tags without touching the site’s code directly. This matters for service businesses where the website developer and the marketing team are often different people.
Client-side tracking, where the JavaScript runs in the visitor’s browser, is the most common method. Server-side tracking, where data is sent from your web server rather than the browser, is more accurate because it is not affected by ad blockers or browser privacy settings. For most small and medium businesses, client-side tracking via GA4 and Tag Manager is sufficient to start.
Pro Tip: Use the phone call tracking guide from gtwelve to extend your GA4 setup to capture inbound calls as conversion events. Trades and service businesses miss a significant share of their leads by not tracking calls.
What are website metrics and how do you interpret them?
Metrics are the numbers your analytics platform reports. The challenge is not collecting them. The challenge is reading them correctly.
The metrics that matter most
| Metric | What it measures | What to watch for |
|---|---|---|
| Conversion rate | Percentage of sessions that complete a goal | B2B SaaS benchmarks sit at 1%–3%; high-intent pages can reach 8%–15% |
| Bounce rate | Sessions where the visitor leaves without interacting | High bounce on a landing page signals a mismatch between ad copy and page content |
| Session duration | Average time spent per visit | Short duration on a content page suggests the content is not meeting visitor expectations |
| New vs returning users | Ratio of first-time to repeat visitors | A healthy ratio sits around 60–70% new users and 30–40% returning users |
Why blended averages mislead
A site-wide conversion rate of 2% sounds reasonable until you segment by channel. Organic search visitors might convert at 4%, while social media visitors convert at 0.5%. Treating those as one number leads to poor budget decisions. Segment every key metric by traffic source, device type, and page category before drawing conclusions.
The same logic applies to bounce rate. A high bounce rate on a contact page is a problem. A high bounce rate on a blog post where the visitor read the full article and then left is not necessarily a problem at all.
Going beyond numbers with behavioural tools
Standard metrics tell you what happened. Heatmaps and session recordings tell you why. A heatmap shows where visitors click, scroll, and hover. A session recording plays back individual visits so you can see exactly where someone hesitated or left. These tools are particularly useful for identifying broken elements, confusing layouts, or calls-to-action that visitors scroll past without noticing.
For website performance tracking across an SME site, combining GA4 metrics with a behavioural tool gives you a complete picture that neither provides alone.
How to use website analytics to improve marketing and engagement
Analytics data only creates value when it changes a decision. Here is how to apply it practically.
- Define your conversion events first. Configuring specific goals before you start reviewing data is the difference between measuring business value and measuring vanity metrics like total page hits. Decide what counts as a lead, a sale, or a meaningful engagement, then set those up as events in GA4.
- Align content to user intent. If your analytics show that visitors from organic search spend three times longer on service pages than visitors from social media, that tells you organic visitors arrive with higher intent. Prioritise content and budget accordingly.
- Evaluate marketing channels by outcome, not volume. A channel that sends 5,000 visitors but converts at 0.3% is less valuable than one that sends 500 visitors and converts at 5%. Use your conversion rate data to make that comparison accurately.
- Identify drop-off points in your funnel. If 80% of visitors reach your enquiry page but only 20% complete the form, the problem is on that page. Analytics shows you where the drop-off happens; behavioural tools show you why.
- Review data on a fixed schedule. Weekly reviews catch short-term issues like a broken form or a failed campaign. Monthly reviews reveal trends in audience behaviour and channel performance. Quarterly reviews inform budget and content strategy decisions.
The goal is continuous, iterative improvement. Small, data-led changes compound over time into meaningful gains in lead generation and customer engagement.
Common challenges in website analytics management
Most businesses collect data well before they learn to use it well. These are the pitfalls that cause the most wasted effort.
- Data overload. Reporting dashboards can display dozens of metrics simultaneously. Focus on five to eight key indicators that directly reflect your business goals. Everything else is context, not priority.
- Vanity metrics. Total pageviews and raw visitor counts feel impressive but tell you nothing about business health. Active goal configuration is what separates useful reporting from decorative reporting.
- Ignoring context. A traffic drop in august is often seasonal, not a sign of a technical problem. Always compare data to the same period in the previous year, not just the previous month.
- Confusing traffic with behaviour. Knowing that 1,000 people visited your site this week is traffic data. Knowing that 700 of them left within 10 seconds is behavioural data. The second number is far more useful for making improvements.
- Relying on third-party estimates. External tools that estimate competitor traffic are useful for benchmarking, but first-party data from your own site is the only source precise enough for internal decisions.
Key takeaways
Website analytics creates business value only when data is segmented, goals are configured, and insights are acted on consistently.
| Point | Details |
|---|---|
| Define conversion events first | Configure specific goals in GA4 before reviewing reports to avoid measuring vanity metrics. |
| Segment every key metric | Split data by channel, device, and page type to avoid misleading site-wide averages. |
| Combine metrics with behavioural tools | Use heatmaps and session recordings alongside GA4 to understand why visitors behave as they do. |
| Use first-party data for decisions | Your own site data is precise; third-party estimates are only useful for competitor benchmarking. |
| Review on a fixed schedule | Weekly, monthly, and quarterly reviews each serve a different decision-making purpose. |
What working with analytics data actually taught me
Most business owners I speak with assume their analytics are “set up” because GA4 is installed. The tracking code being present is not the same as analytics being configured. Without defined conversion events, you are collecting data about visits, not about business outcomes. That distinction took me a while to fully appreciate, and it changes everything about how you read a report.
The other thing I have noticed is that behavioural data consistently surprises people. A client once assumed their enquiry form was performing well because traffic to the page was strong. A session recording showed that most visitors were abandoning the form at the third field because it asked for a budget figure they were not ready to commit to. Removing that field increased completions significantly. No amount of GA4 metric-watching would have surfaced that insight on its own.
My honest recommendation is to start narrow. Pick three metrics that directly reflect your business goals. Review them weekly. Add complexity only when you have exhausted what those three metrics can tell you. Chasing every number in your dashboard is the fastest route to making no decisions at all.
— Ben
How gtwelve helps businesses get more from their website data
Understanding what your analytics are telling you is one thing. Having the right setup to capture the right data is another.

gtwelve works with UK service businesses to build websites that are configured to track the enquiries, calls, and conversions that actually matter. From GA4 setup and event configuration to reporting that connects website performance to real business outcomes, gtwelve handles the technical side so you can focus on acting on the insights. If your current analytics feel more confusing than useful, visit gtwelve.co.uk to find out how a properly configured setup changes what you can see and decide.
FAQ
What is the difference between web analytics and website traffic analytics?
Web analytics covers the full picture: traffic, behaviour, and conversions. Website traffic analytics refers specifically to the volume and source of visits, which is one component of the broader discipline.
How do I set up website analytics for my business site?
Create a Google Analytics 4 account, add a web data stream for your domain, and install the tracking code via Google Tag Manager. Then configure conversion events for the specific actions you want to measure.
What is a good website conversion rate?
B2B SaaS benchmarks place typical conversion rates at 1%–3% site-wide, with high-intent pages reaching 8%–15%. Service business rates vary, but anything below 1% on a key landing page warrants investigation.
Why are my analytics showing high traffic but low conversions?
High traffic with low conversions usually signals a mismatch between visitor intent and page content, a poor user experience, or an unclear call-to-action. Segment your traffic by source and use session recordings to identify where visitors are leaving.
What is first-party data in website analytics?
First-party data is information collected directly from your own website visitors via your analytics tracking code. It is more accurate than third-party estimates and is the correct source for internal business decisions.
Recommended
If this sounds like your website, we can take a look.
Note 21 of 72