What is conversion rate on a website?
30 May 2026 · 3 min read
What is conversion rate on a website?

Your website might be attracting hundreds of visitors every month, yet your enquiries remain flat. That gap is where conversion rate becomes one of the most revealing numbers in your business. Understanding what is conversion rate for a website goes beyond a simple percentage. Calculated as (Conversions ÷ Total Visitors) × 100, it connects your traffic to real business outcomes. But the figure only tells you something useful when you are measuring the right actions, with the right denominator, over a consistent period. This article covers the conversion rate definition, how to calculate it accurately, realistic benchmarks, and practical ways to improve it.
Table of Contents
- Key takeaways
- What conversion rate means on a website
- Calculating conversion rate: formulas and nuances
- Benchmarks: what counts as a good rate
- How to improve your website conversion rate
- My take on how businesses get this wrong
- How gtwelve can help you convert more enquiries
- FAQ
Key takeaways
| Point | Details |
|---|---|
| Define conversion clearly first | Decide exactly which visitor action counts before you calculate anything, or your metric is meaningless. |
| Denominator choice changes results | Sessions and unique visitors produce different rates from the same raw data, so pick one and stay consistent. |
| Benchmarks are context-dependent | A 3% rate is strong for luxury goods but weak for a B2B SaaS trial signup page. |
| Segment before you optimise | Site-wide rates hide drop-off points; analyse by page, device, and traffic source to find real problems. |
| GA4 calls them key events now | GA4 renamed conversions to key events, measured as session or user key event rates. |
What conversion rate means on a website
Conversion rate is the recognised industry term for the metric most people describe loosely as “how many visitors did something.” In web analytics, a conversion is any visitor action that has business value. That definition sounds obvious, but conversion definitions vary widely depending on your business model, and getting it wrong produces numbers that look meaningful but are not.
There are two categories worth understanding here.
Macro conversions are your primary goals. For an e-commerce site, that is a completed purchase. For a service business, it might be a submitted enquiry form or a booked consultation. For a SaaS company, it is typically a free trial activation or a demo request.
Micro conversions are smaller steps that signal intent. Examples include:
- Viewing a pricing page
- Downloading a brochure or guide
- Watching a product demonstration video
- Clicking a phone number or email address
- Adding an item to a basket without completing checkout
Micro conversions matter because they tell you where interest exists even when the final action has not yet happened. A trade business whose contact form rarely gets filled might find that a high percentage of visitors click the phone number. That click is a conversion too, and tracking phone calls from website visitors alongside form submissions gives you a far more complete picture.
Pro Tip: Write down your primary conversion goal before you open any analytics tool. If two people in your business would define ‘conversion’ differently, you need alignment first.
The practical reason this matters: e-commerce focuses on purchases, SaaS on trials or demos, and content sites on subscriptions or newsletter signups. A service business like a plumber or accountant is typically measuring form fills, phone calls, or calendar bookings. Each business type needs its own definition before measuring anything.

Calculating conversion rate: formulas and nuances
The basic formula is straightforward. Take the number of conversions in a period, divide by total visitors or sessions in the same period, then multiply by one hundred. So 150 purchases from 5,000 visitors gives you 3.0% conversion rate.
Where it gets more nuanced is in the denominator you choose. There are three main options, and they produce noticeably different numbers from identical data:
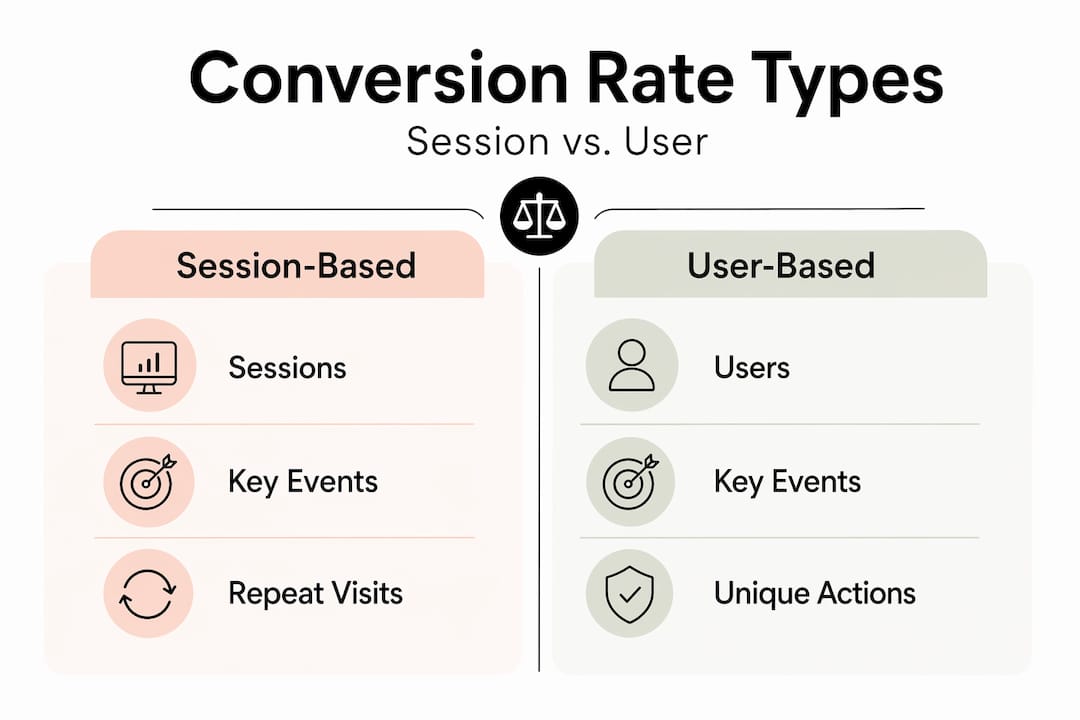
- Sessions: Every visit counts, including repeat visits from the same person. If someone visits your site three times before booking, that is three sessions. Using sessions as the denominator tends to produce a lower conversion rate.
- Unique visitors (users): Each person is counted once regardless of how many times they visited. This removes the repeat-visit inflation from your denominator. The same 200 purchases from 7,000 unique visitors gives you approximately 2.86% user-based rate, compared to 2.0% from 10,000 sessions.
- Clicks: Used primarily in paid advertising. If 500 people clicked your Google Ad and 20 filled in your form, your click-to-conversion rate is 4%.
The choice of denominator is not just a technical preference. It affects how you interpret performance and where you focus effort. User-based conversion rate in GA4 provides a more accurate picture for businesses with longer consideration cycles, where customers visit multiple times before deciding. Session-based rates can understate the total number of people who eventually convert.
Here is a quick comparison:
| Denominator | Example | Conversion rate | Best used for |
|---|---|---|---|
| Sessions | 200 conversions / 10,000 sessions | 2.0% | E-commerce, paid traffic analysis |
| Unique visitors | 200 conversions / 7,000 users | 2.86% | Service businesses, longer sales cycles |
| Clicks | 20 conversions / 500 ad clicks | 4.0% | Paid advertising campaign performance |
One more layer: GA4 has renamed conversions to key events, tracked as either session key event rate or user key event rate. If you are setting up reporting in GA4 today, you will see this language rather than the older “conversion rate” label. The underlying maths is the same, but the terminology shift catches many people off guard.
Pro Tip: Always match your numerator and denominator to the same date range and traffic source. Comparing February conversions against January sessions, or mixing organic and paid visitors, produces figures that cannot be trusted.
Benchmarks: what counts as a good rate
This is the question every business owner asks, and the honest answer is that benchmarks are useful sanity checks, not hard targets. Industry average conversion rates vary considerably: e-commerce typically sits between 1.5% and 3%, B2B averages around 1.9%, and legal services can reach up to 7.4%. Top-performing e-commerce sites reach between 3.2% and 4.7%.
Why do benchmarks vary so much? Several factors drive the differences:
- Traffic quality: Paid traffic from highly targeted keywords converts more readily than broad organic traffic.
- Product or service complexity: A SaaS tool requiring a credit card converts less often than a free newsletter signup.
- Sales cycle length: A business selling bespoke kitchens will see lower rates than one selling off-the-shelf products, because the buying decision takes longer.
- Price point: Higher-value purchases involve more consideration and fewer impulse decisions.
A 3% conversion rate is excellent for luxury furniture but unremarkable for a B2B SaaS free trial. Benchmarks only help when compared within the same category and traffic type.
The most reliable benchmark is your own historical data. If your service business website converted at 1.8% last quarter and it is now at 2.4%, that improvement is meaningful regardless of what the industry average says. Your trend line is far more actionable than a competitor’s published number.
How to improve your website conversion rate
Most conversion rate issues come down to three root causes: visitors cannot find what they need, they do not trust what they see, or the process of converting is too difficult. Addressing these systematically is more effective than guessing.
Start with user experience fundamentals. Page speed directly affects how many visitors stay long enough to convert. Clear calls to action, relevant offers, and optimised forms consistently lift rates, with well-optimised landing pages converting between 2% and 5%, and top performers reaching 8% to 12%. Trust signals, including reviews, accreditations, case studies, and clear contact details, reduce hesitation, particularly for service businesses where the visitor has not met you yet.
Next, look at where conversions are dropping off rather than relying on a single site-wide figure. Tracking conversions at multiple funnel levels reveals problems that one overall rate conceals. An ad-to-landing page mismatch, a confusing contact form, or a pricing page with no clear next step all produce distinct drop-off patterns. Understanding where website enquiries disappear is often more valuable than knowing your overall rate.
Practical steps to take:
- Segment your data by landing page, traffic source, and device. Mobile and desktop users often behave very differently.
- Use heatmaps and session recordings to see where visitors scroll to, what they click, and where they leave.
- Run A/B tests on specific elements: headline copy, button text, form length, and page layout. Test one variable at a time so results are interpretable.
- Gather direct feedback via short on-page surveys or post-enquiry emails. Visitors who nearly converted but did not will often tell you why.
Pro Tip: Misinterpreting vanity metrics is one of the most common and costly mistakes. A spike in traffic is only good news if your conversion rate holds. If rate drops as traffic rises, your new visitors are simply less qualified. Always look at both together.
One often-overlooked area is conversion event accuracy. If your analytics is counting page views or button clicks as conversions rather than actual form submissions or completed bookings, your rate is meaningless. Tracking website enquiries and conversions correctly is the foundation of everything else. Without accurate data, optimisation decisions are guesswork.
My take on how businesses get this wrong
I have worked with a lot of service businesses on their websites, and the single most overlooked step is agreeing on what a conversion actually is before looking at any data. Most owners assume it means “someone bought something” or “someone filled in a form,” but service businesses are more complex than that. A phone call, a chat message, a quote request, and a booking are all different conversions with different values, and lumping them together obscures the truth.
The second thing I see regularly is an over-reliance on session-based rates when the business has a longer consideration cycle. A local builder, a solicitor, or a bespoke joinery company will see visitors return two or three times before they make contact. User-based rates are more meaningful for these businesses, because they reflect actual people making decisions rather than visit counts.
What real-world testing has taught me is that most conversion barriers are not about design. They are about clarity. Visitors do not understand what happens after they click the button. They cannot find a price range. They are not sure the business serves their area. Fixing those communication failures often lifts conversion rate faster than any design change.
My advice: resist the urge to optimise until you have defined your conversions clearly, confirmed your tracking is accurate, and segmented your data enough to see where the actual friction lives. The numbers will tell you what to do. You just need to ask the right questions first.
— Ben
How gtwelve can help you convert more enquiries

If this article has made you realise your website’s conversion tracking is incomplete or your rate is harder to interpret than it should be, gtwelve works with UK service businesses to fix exactly that. From setting up accurate conversion tracking and building conversion-focused websites to connecting enquiries into quote workflows, calendars, and follow-up systems, gtwelve treats conversion not as a single metric but as a full process. You will know which pages generate enquiries, where visitors drop off, and what happens to every lead after they make contact. If your website should be doing more, it is worth a conversation.
FAQ
What is conversion rate on a website?
Conversion rate is the percentage of website visitors who complete a desired action, calculated as (Conversions ÷ Total Visitors) × 100. The action can be a purchase, form submission, phone call, or any other goal you define.
What is a good conversion rate for a service business website?
Average B2B conversion rates sit around 1.9%, while well-optimised service pages convert between 2% and 5%. Your own historical trend is a more useful target than an industry average.
What is the difference between session-based and user-based conversion rates?
Session-based rate divides conversions by total sessions, counting repeat visits separately. User-based rate divides conversions by unique visitors, so each person is counted once. User-based is generally more meaningful for service businesses with longer buying cycles.
How does GA4 measure conversion rate now?
GA4 renamed conversions to key events and reports them as session key event rate or user key event rate. The calculation method is the same, but you select which actions qualify as key events within your GA4 settings.
Why is my conversion rate so low even though traffic is growing?
Growing traffic with a falling conversion rate usually means the new visitors are less qualified or your pages do not match their intent. Segment your data by traffic source and landing page to identify which channels and pages are underperforming.
Recommended
If this sounds like your website, we can take a look.
Note 55 of 72