Website performance tracking: a 2026 guide for smes

Website performance tracking is the continuous practice of measuring and optimising a website’s technical health to ensure fast, responsive, and stable user experiences. For service-based SMEs, this is not a technical luxury. It is a direct driver of enquiries, conversions, and search visibility. 53% of mobile users abandon a site that takes longer than three seconds to load. That single figure shows how quickly a slow website costs you real business. Tools like Google PageSpeed Insights, GTmetrix, and Pingdom make it possible to measure and act on these issues without needing a full-time developer.
What key metrics are critical for tracking website performance?
Performance metrics for websites fall into two categories: Core Web Vitals, which Google uses directly in its ranking algorithm, and supporting technical signals that help diagnose root causes. Understanding both gives you a clear picture of where your site stands.
The three Core Web Vitals to know are:
- Largest Contentful Paint (LCP): This measures how long it takes for the main content of a page to load visibly. The benchmark is under 2.5 seconds. A slow LCP is usually caused by large images, slow server responses, or render-blocking scripts.
- Interaction to Next Paint (INP): This measures how quickly your site responds when a visitor clicks a button or fills in a form. The target is under 200ms. A sluggish INP makes your site feel broken, even if it looks fine.
- Cumulative Layout Shift (CLS): This measures visual stability. A score under 0.1 means your page does not jump around as it loads. High CLS is a common problem on pages with late-loading images or adverts.
Beyond Core Web Vitals, Time to First Byte (TTFB) is worth monitoring. TTFB measures how quickly your server starts responding to a request. A high TTFB often points to hosting quality or server configuration issues.
Perceived performance matters more than raw load time. A page that loads in four seconds but shows useful content within one second will feel faster than a page that loads in two seconds but shows nothing until the very end. LCP and INP capture this distinction far better than a simple “page load time” figure.

Pro Tip: When reviewing your scores in Google PageSpeed Insights, focus on the “Field Data” section first. This reflects real visitor experiences, not just a simulated test result.
How do synthetic monitoring and real user monitoring differ?
Combining synthetic and real user monitoring gives you the most accurate picture of your website’s health. Each method answers a different question, and relying on only one leaves gaps.
| Method | What It Measures | Best Used For | Example Tools |
|---|---|---|---|
| Synthetic Monitoring | Simulated tests in controlled conditions | Catching regressions after updates, benchmarking | Google PageSpeed Insights, WebPageTest, GTmetrix |
| Real User Monitoring (RUM) | Actual visitor experiences across devices and locations | Understanding real-world impact, SEO field data | Chrome User Experience Report (CrUX), Google Search Console |
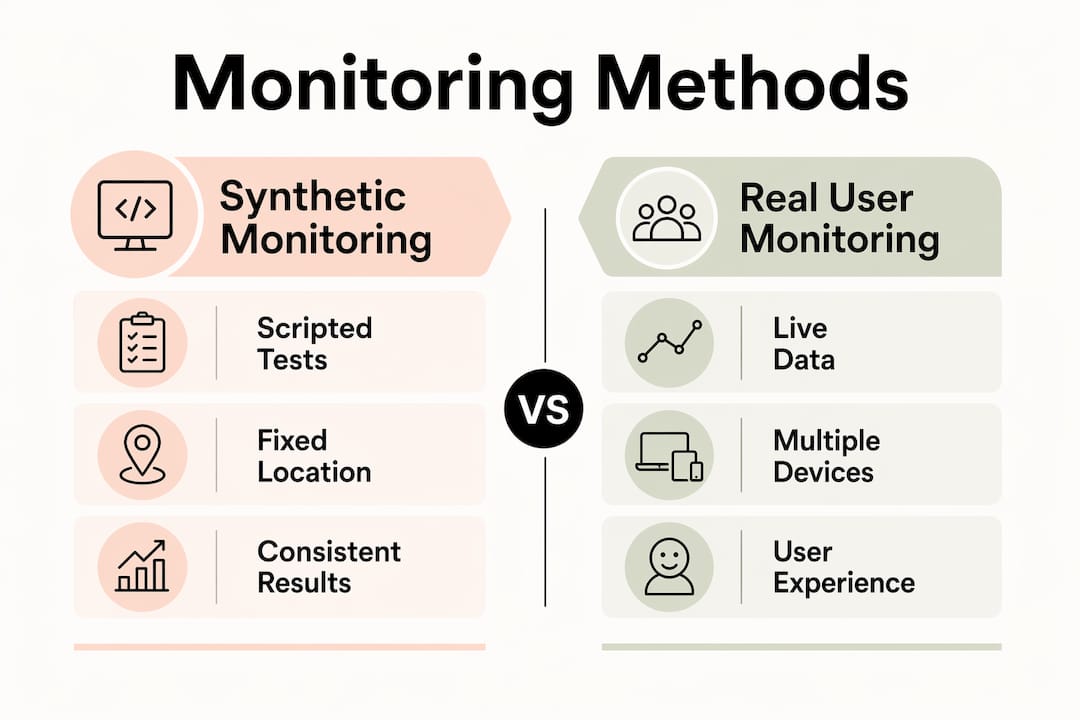
Synthetic monitoring runs a scripted test from a fixed location and device. It is consistent and repeatable, which makes it ideal for comparing your site before and after a change. Run synthetic tests monthly as a baseline, and always after a significant update or new page deployment.
Real User Monitoring (RUM) captures data from actual visitors as they use your site. It reflects the full range of devices, connection speeds, and locations your audience uses. Field data from CrUX is what Google uses to assess your Core Web Vitals for search rankings. A perfect synthetic score does not guarantee a good ranking if your real-world field data tells a different story.
Google Search Console shows your Core Web Vitals field data for free. It groups your pages into “Good,” “Needs Improvement,” and “Poor” categories based on real visitor data. This is the most direct signal of how Google perceives your site’s performance.
Pro Tip: Use Google PageSpeed Insights to see both lab and field data side by side for any URL. It is the fastest way to spot a gap between your controlled test score and your real-world performance.
What practical steps can smes take to start tracking performance?
Prioritising business-critical pages yields better returns than attempting to audit every page at once. A focused approach gets results faster and avoids wasting time on pages that do not drive enquiries.
Follow these steps to build a practical tracking process:
-
Identify your priority pages. Start with your homepage, your main service pages, and any pages you use in paid campaigns. These are the pages where performance problems cost you the most. For guidance on which pages matter most, the key pages for trades article from gtwelve is a useful reference.
-
Set performance budgets. A performance budget defines the maximum acceptable value for each key metric. For example, LCP must stay under 2.5 seconds and CLS must stay under 0.1. Performance budgets prevent regressions from creeping in during routine website updates. Without them, a well-meaning content change can quietly break your scores.
-
Run your first synthetic audit. Use Google PageSpeed Insights or GTmetrix to test each priority page. Record the scores. This is your baseline. Every future test is measured against it.
-
Set up continuous monitoring. One-off audits miss the regressions that happen between checks. Automated monitoring using tools like Lighthouse CI or GTmetrix’s scheduled monitoring catches problems before they affect real visitors. Most SMEs can set this up with a free or low-cost tool account.
-
Connect performance to business outcomes. Google Analytics 4 can track Core Web Vitals as events, letting you see performance trends alongside enquiry and conversion data. This is the step that turns technical data into a business case for improvement.
-
Review and act monthly. Schedule a monthly review of your priority pages. Compare current scores against your baseline. If a score has dropped, investigate what changed on the site around that time.
Pro Tip: If you use Google Search Console, set up email alerts for Core Web Vitals issues. Google will notify you directly when a page moves into the “Poor” category, so you do not need to check manually every week.
What are the common pitfalls in website performance tracking?
Most SMEs who start tracking performance make the same handful of mistakes. Knowing them in advance saves significant time and frustration.
-
Relying only on synthetic scores. A high score in GTmetrix or Google PageSpeed Insights is encouraging, but it does not reflect what your actual visitors experience. Real devices, real networks, and real locations all produce different results. Always cross-reference with field data.
-
Treating all pages equally. Spending hours improving the performance of a blog post from three years ago while your main service page loads slowly is a poor use of time. Focus effort where it affects revenue.
-
Confusing load time with perceived performance. Raw load time is a poor proxy for user experience. A visitor does not care how long the full page takes to load. They care how quickly they can read the headline and click the button. LCP and INP measure what actually matters.
-
Skipping continuous monitoring. A site that scores well today can regress after a plugin update, a new image upload, or a third-party script change. Continuous monitoring is the only way to catch these regressions before they affect your search rankings and enquiry rates.
-
Failing to link performance to business metrics. Tracking scores in isolation tells you nothing about impact. Connect your performance data to conversion rate and enquiry tracking to understand what improvements are actually worth making.
“Fast, stable websites reduce bounce rates and increase conversions, making website performance a core element of digital marketing strategy, not just technical upkeep.” Web Performance: Benefits, Tracking, and Tools
Key takeaways
Effective website performance tracking requires combining real user data with synthetic tests, prioritising business-critical pages, and connecting technical scores to conversion outcomes.
| Point | Details |
|---|---|
| Core Web Vitals are the priority | Track LCP, INP, and CLS against Google’s benchmarks to protect search rankings and user experience. |
| Use both monitoring methods | Synthetic tests catch regressions; real user monitoring reveals what actual visitors experience. |
| Prioritise high-value pages | Focus tracking on service pages and landing pages before auditing lower-traffic content. |
| Set performance budgets | Define maximum acceptable metric values to prevent regressions during routine site updates. |
| Connect data to business outcomes | Link performance improvements to enquiry and conversion tracking to measure real business impact. |
The part most smes get wrong
I have worked with enough service businesses to spot the pattern quickly. The owner runs a Google PageSpeed Insights test, sees a score of 72, and either panics or dismisses it entirely. Neither response is useful.
The score is not the point. The question is: which pages are losing you enquiries right now, and why? A plumber’s contact page loading slowly on a mobile in a 4G signal is a real problem. A slow-loading blog post about boiler maintenance from 2021 is not urgent.
What I find works best is starting with Google Search Console’s Core Web Vitals report. It shows you real data, grouped by page, based on actual visitor experiences. That is your starting point. From there, you run a targeted synthetic test on the problem pages using Google PageSpeed Insights or WebPageTest to understand the specific cause.
The other thing I would push back on is the idea that this is a one-off task. Performance degrades over time. A new plugin, a heavier image, a third-party chat widget added by the marketing team. Any of these can quietly push your LCP from 2.1 seconds to 3.4 seconds without anyone noticing. Monthly checks on your priority pages take less than 30 minutes and protect the investment you have already made in your site.
Treat performance tracking the same way you treat your accounts. You would not check your finances once and assume everything is fine for the next two years. Your website deserves the same discipline.
— Ben
How gtwelve helps smes get more from their website
If you have read this far, you already understand that website performance is not just a technical concern. It affects how many enquiries you receive, how well your site ranks, and how professional your business looks to potential clients.

gtwelve builds performance-focused websites for UK service businesses and trades, with ongoing monitoring and reporting built into the process. Every site we deliver is tested against Core Web Vitals benchmarks, and we connect performance data to enquiry tracking so you can see the business impact directly. If your current site is slow, unstable, or simply not generating the leads it should, see how we work and find out what a properly built and monitored website can do for your business.
FAQ
What is website performance tracking?
Website performance tracking is the ongoing measurement of a website’s speed, responsiveness, and stability using metrics like LCP, INP, and CLS. It helps businesses identify and fix issues that reduce engagement and conversions.
Which tools are best for measuring site speed?
Google PageSpeed Insights, GTmetrix, and WebPageTest are the most widely used tools for measuring site speed. Google Search Console provides free real-user field data directly relevant to your search rankings.
How often should i check my website’s performance?
Run synthetic tests monthly and after any significant site update or deployment. Set up automated monitoring so you are alerted to regressions between scheduled checks.
What affects website performance most?
Large uncompressed images, slow server response times, render-blocking scripts, and third-party tools like chat widgets or tracking pixels are the most common causes of poor performance on SME websites.
Does website speed affect google rankings?
Yes. Google uses Core Web Vitals field data from the Chrome User Experience Report as a ranking signal. Pages with poor LCP, INP, or CLS scores are at a disadvantage in search results compared to faster, more stable competitors.